Tuesday, March 20, 2007

Saturday, March 17, 2007


Naz 2373
Resistance: 2405 (EMA20)
Support: 2332 (38%)


Spx 1387 .
Resistance: 1405(EMA20)
Support: 1365 (38%, EMA200)


Dow 12110 .
Resistance: 12295 (EMA20)
Support: 11950 (38%,EMA200)

Amateur

Friday, March 16, 2007

Notice CME around 3PM when the stock traded around 520$, and both Mar520 Call and Put traded around 1$. The stock has fallen a lot for the day, and I was thinking it might close at 520$, BUT forgot one fact that what the real market is telling us.
Look at the chart, after forming a double bottom, the stock bound back beautifully from 520 to close above 525, while the Call option closed at 5.10.
So technical analysis is always the basis for trading, just follow the trend, do let other preset-mind lead you.

Thursday, March 15, 2007

Wait For Follow-Through Day Before Buying
Mistakes 1:

For the first several minutes, market opened slight up and starts to climb, then I jumped in for 10 May QQQQ call at 1.56. This is stupid, as I already predicted the market is going to be quite as we approch the OE day. But once I saw the Q climbing, I felt I should buy some calls to compensate my Puts. And denied the fact that the market didn't have momentum to go up today, so I bot the call at the highest price, though the stock came back to 43 level but the call never came above 1.56...

Have to sell tommorrow!!
1. if market opens higher, sell,
2. if market opens flat or lower, wait for chance to sell

Mistake 2:
before the close, saw somebody mentioned usna on mitbbs, which down 15% for rumor on their health products, then jumped in bot April 50 Put at very high price 3.7. The option closed at 3.4. If the news went away, the option will drop more even if the stock keeps falling.

Don't let emotion or gambling feeling dominate you, keep calm always.

Plan: 1. if solf the Q call, prepare to buy some index puts
2. buy some double short EFT for the IRS account.(sold Q call and bot some qid for irs)

Wednesday, March 14, 2007

QQQQ pivot point
43.22
42.66
42.32
QQQQ formed a beautiful double bottom at noon and rebound in another beautiful extended w. Today, I was totally insentitive to the market, and stick to my ego, that the market is going down. I exited half April 143 put at good profit, but the profit for the remaining was eaten away. The mistake I made is I bot some May 143 Put too early..., should check the whole market and wait....


Spy has similar pattern. If I am sensitive enough, should also quit from the May Put.
Yesterday bot Leh April strangle. This morning both put and call opened lower than yesterday's close due to the relief of its high valatility after the earnings. Leh slided below 68, the put increased to 4 (bot at 2.1), in any case should take profit for the put here, but I didn't, still hold both put and call.

The lesson, if one side option got double in a short time, should take profits!!!

Sold GOOG April 390 Put @ 2.4 for break even when GOOG stayed around days' bottom 440, a good step. Because GOOG has reached its short term bottom again, and this put is too deep out of the money, the decay will accelerate next week.

Tuesday, March 13, 2007

Spy
Support 137.35 (last low)
136 (EMA200)
Resistance 141.4 (last high)

QQQQ
Support 42.16 (EMA200)
41.9 (last low)
Resistance 43.24 (last high)

Leh
Support 70-70.5 (last low)
67
Resistance 76.63(last high)

Saturday, March 10, 2007

Earnings of the Week

Mon
ACH
MR0.13
STP0.20

Tue
GS4.90

Wed
GM1.19
LEH1.95
JUPM0.06

Thur
BSC3.80
BONT4.56
Big Picture of the Martket


Near term support (EMA200) and Resistance (EMA20)
Dow 12276 12381 <---> 11950
Naz 2388 2423.6 <---> 2340
Spx 1403 1415.5 <---> 1366

Big Picture

AAPL PUT play for OE week

Price as 3/9/07 for aapl put
Strike Mar April
85 0.3 1.85
90 2.4 4

1. buy April85Put 1.755 (27.85% volatility) then
Fri.85 2.74 56%
Fri.90 1.05 -40.2%
Gain/loss: 1.39:1

2. April90Put 3.92 (26%)
85 5.74 46.4%
90 2.69 -31.4%
Gain/loss: 1.48:1


3. Mar90Put 2.24 (22.5%)
85 5 118%
90 0 -100%
===========================
GOOG 452.96, April 450 Put Fri. 14.5 IV 27.7%

Mon GOOG452.96, 14

Fri.GOOG440, 19.6, 40%
Fri.GOOG450, 14.4, 2.8%
Fri.GOOG460, 10.27, -26.6%

Friday, March 09, 2007


Evidence of stock price clustering at strike price.

For the past year at every month's OE day (vertical cyan grid),both AAPL and GOOG tended to close at strike price (horizontal grid). If AAPL and GOOG can be manupulated on such a degree of precision, let alone other small cap stocks.

Let's just wait for a week, see where AAPL and GOOG ends up on Friday?

Thursday, March 08, 2007

Today closed RMBS Mar.20 Call at 0.7, take heavy loss!!!

Bought
4 SPY May 140 Put at 2.7
20 QQQQ April 43 Put at 1.035 (average of 1+1.07)
39 QID at 55.157

Option seems relatively expensive during the opening session of the market, this high volatile time should be avoided for buying options if not for day trading. Early afternoon seems a better time for entering option order, when the market become stable and bored.
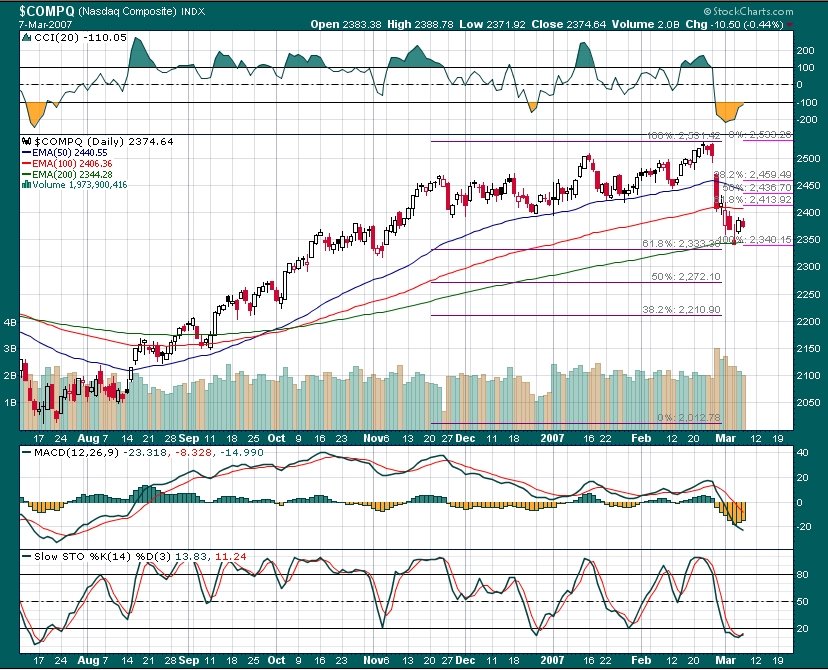
NAS 2389,
Resistance: 2406 (EMA100)-2414(38.2%); 2438(EMA50)
Support: 2344(last low, EMA200)

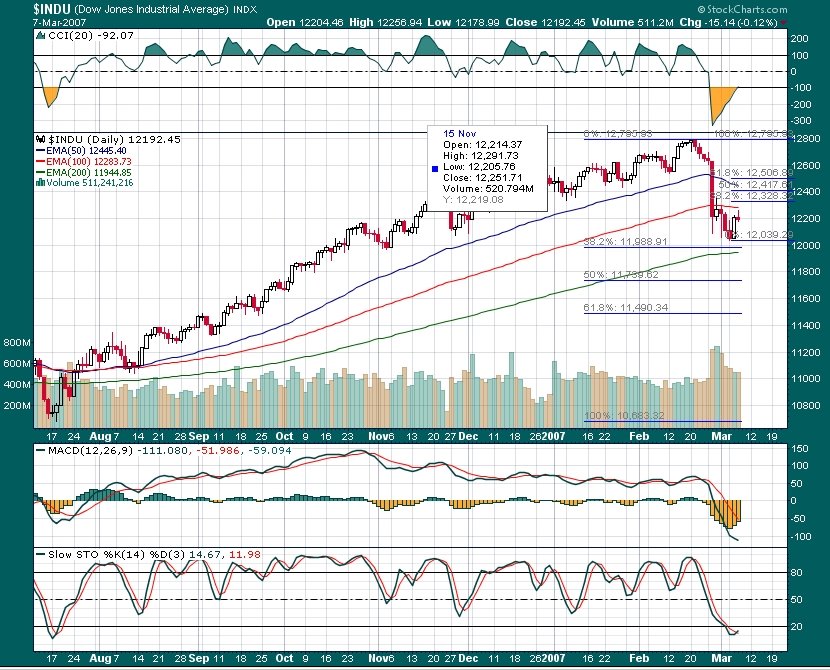
Dow 12261
Resistance: 12283(EMA100)-12328(38.2%); 12438
Support: 12039(last low), 11989(38.2%), 11948(EMA200)

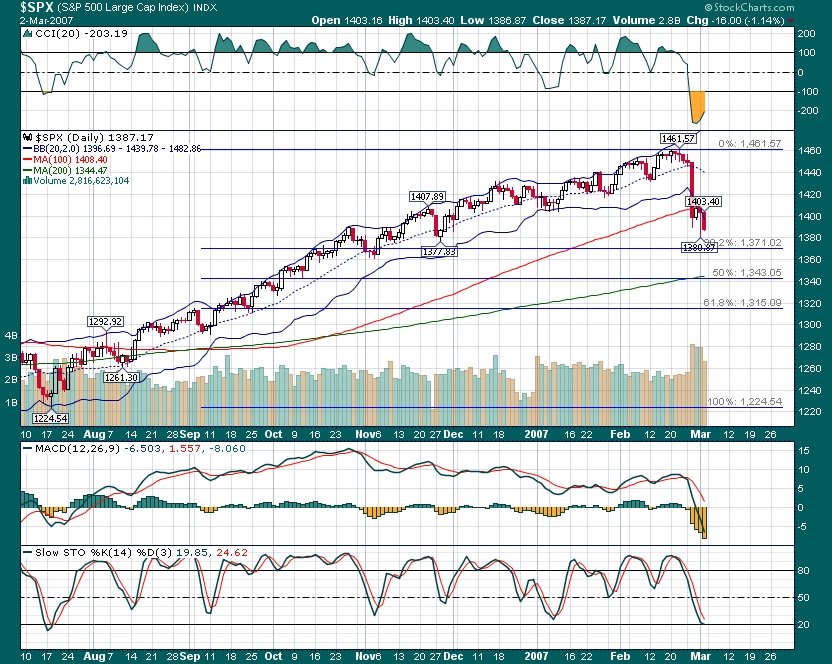
SPX 1402
Resistance: 1403(EMA100)-1407.5(38.2%); 1421
Support: 1371(last low) 1374(38.2%) 1365(EMA200)


Nasdaq vs ^VIX curve, watch the price drop on the index and the uprising on the VIX

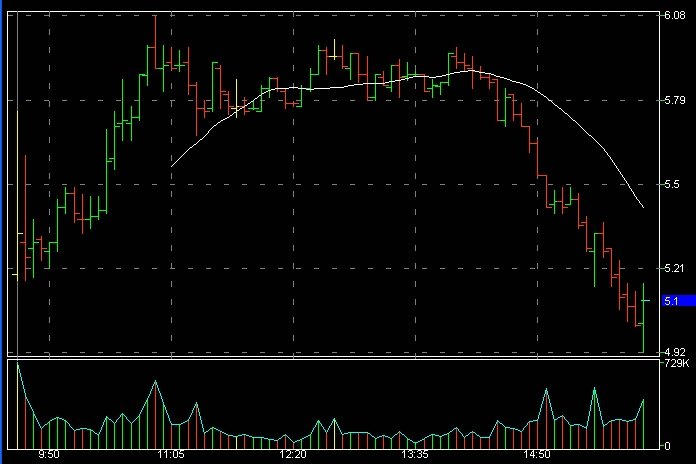
Tody, Mama opened high in huge volume due to its strong earnings.

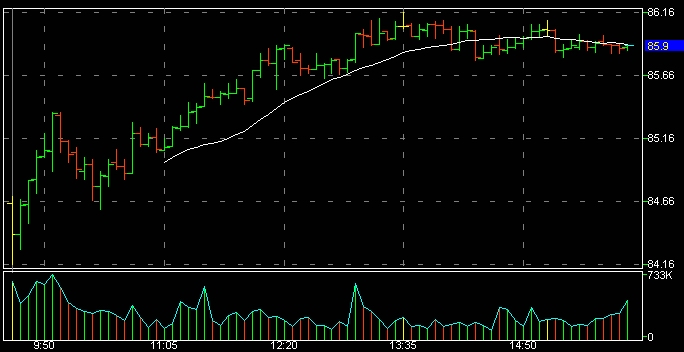
Entered at 6.08 in 2nd up waves, then it made a high at 6.2 and another higher high at 6.22, then it retrace backe and made a lower high 6.16. This is a strong signal for exit. Should get out around 6.05. however, I just ignored the signal and until it broke down around 5.9, out at 5.84, lost 0.22 cents.

Never ignore the market signal, don't trade on hope!!!!

Wednesday, March 07, 2007

watch List

Vlo 59.8 break out, Jun Call option
60.00 VLOFL.X 3.70 0.80 3.70 3.80 2,821 9,672
62.50 VLOFZ.X 2.55 0.50 2.55 2.70 10,898 3,186

April 60 Call 1.2
May 60 call 1.6
Jun 60 call 3.2

ICE 128, support around 123-126

MA 99.7, support around 95


NAS 2374.6,
Resistance: 2406 (EMA100)-2414(38.2%); 31-39 points
Support: 2344(last low)-2340 (EMA200); 31-35 points

Dow 12192
Resistance: 12284(EMA100)-12328(38.2%) 92-136 points
Support: 12039(last low), 11989(38.2%), 11945(EMA200) 153-247 points

SPX 1392
Resistance: 1403(EMA100)-1407.5(38.2%); 11-16 points
Support: 1371(last low) 1374(38.2%) 1366(EMA200); 21-26 points


NEW was very active again in early session. I was tempted to play it again.

Entered in at 5.48 in a rising with big volume, after seeing double top around 5.77, then exited the position at 5.74. Earned some grace back from yesterday's loss.

NEW spent the whole day in a berish trend.

Lesson: I still think I got a little bit emotion for the trade as I wanted to win the game back. I was luck for that, but this doesn't mean I have my strategy going well. Never trade with uncontrolled emotions.

Tuesday, March 06, 2007

New showed strength with huge volume, get in @5.90 on the big rise, then the stock went sideway with dimished volume, should be out in break even, but I was hoping it might turn higher in the afternoon. Around 2pm, the stock break down, out at 9.65, took loss 250$.

Lesson: should not stick to the stock when finding it went side way! DT should bet on those strong upside after entry, otherwise, it means the decision isn't correct.

Goog gapped up about 2% at 451, bought April 480CAll at 8.3, and April 390Put@2.10" 390Put@2.10. Interestingly, both call and put price dropped dramatically when the stock doing consolidation around 451$.

In the afternoon, GOOG has a nice run, to closed @456$. Exited the call @ 9$.

The put closed @1.6 $(actually 1.45)

Lesson: don't buy option in a high volatile time, like this morning market gapped up huge, should wait until the market became stablized!


NAS 2385,
resistance: (2413 38.2%) 2424 (MA100) 1.6%; 2452(MA50)

Dow 12208
Resistance: (12330 38.2%) 12347(MA100) 1.1%

SPX 1395
Resistance: (1406 38.2%) 1409 (MA100) 1.0%
GOOG Option:
premaket 447, up 6$, up target 455-464, support 438,
April 480 Call 7.83 target 10.35-13.78, support 5.55$

Risk too high?
April 390 Put 2.68, target 3.74 (39.6%)
April 400 Put 3.95 target 5.41 (37%)

http://www.ivolatility.com/calc/?ticker=SPX

Monday, March 05, 2007

NAS 2341, 38.2% 2333, weeklyMA50 2296 (-1.92%), MA200 2287, 50% 2272
Dow 12150, 38.2% 11989 (-1.33%), MA200 11785 50% 11740 Weekly MA50 11729 (-3.46%)
SPX 1374, 38.2% 1371, MA200 1345 50% 1343 weekly MA50 1341 (-2.41%)

Sunday, March 04, 2007

GOPCT.X 42.20 7.30 40.30 40.90 247 1,079 400.00 GOPOT.X 0.75 0.05 0.80 0.85 1,068 4,424
GOPCB.X 31.70 5.90 31.00 31.40 69 853 410.00 GOPOB.X 1.45 0.38 1.40 1.45 1,900 3,949
GOPCD.X 22.80 8.10 22.30 22.70 434 1,077 420.00 GOPOD.X 2.70 0.80 2.65 2.75 2,445 6,108
GOPCF.X 15.00 7.61 14.80 15.00 1,117 1,689 430.00 GOPOF.X 5.10 1.90 5.00 5.20 6,262 9,276
GOPCH.X 9.00 6.20 8.80 9.00 6,212 3,138 440.00 GOPOH.X 9.00 3.10 9.00 9.10 7,751 11,717
GOPCJ.X 5.00 4.20 4.80 5.00 12,951 10,974 450.00 GOPOJ.X 14.90 4.90 15.10 15.20 3,491 14,602
GOPCL.X 2.55 2.65 2.50 2.60 10,677 10,678 460.00 GOPOL.X 22.60 6.80 22.60 23.00 1,695 11,478
GOPCG.X 1.30 1.30 1.25 1.30 6,456 15,487 470.00 GOPOG.X 31.50 7.70 31.50 32.00 568 9,038
GOPCI.X 0.75 0.56 0.70 0.75 2,325 17,078 480.00 GOPOI.X 41.00 8.50 40.90 41.60 539 6,053

Saturday, March 03, 2007


GOOG seems a good Call play for near term. It closed at the 50% retracement of 538$, just filled the Oct.20 gap. Both CCI and Bollinger bands indicate a rebound is due. A down side support is the MA200 at 432, and up side resistance at 456$ or 38.2% retracement. Risk/reward ratio is 1:3.

If the stock opens low next monday, it would be a great opportunity to long.

Nasdaq closed at 2368 for the bloody week and lost 6.5% in 10 days. Next week,the index may test the 38.2% retracement at 2333 (1.5% drop) if going lower, and it can be done anytime soon next week. On the other hand, the index has been way oversold, and it can also go up anytime. If it does, the 1st upside resistance will be around 2400, which was roughly the support level during the consolidation period back to Nov-Dec of last year.


The Dow closed at 12114 and lost 5.3% from the peak. Looks like it's also imminent to test the 38.2% retracement at 11986 (1.05% drop). Upside resistance will be at 12354 area, which happens to be the MA100 level.


The SP500 closed at 1387, eyeing for 1371 at the 38.2% retracement.(another 1.15% drop). If the market does touch the 38.2% level, short cover is expected and will lead to a rebounce back to 1400 level.


Just like Dow and Nas, the Spy, now at 139, is also posing to test the 38.2% retracement at 137. If bouncing back, however, the resistance will be around 141 area, which is the MA100 level.


Mdy may also touch the 38.2% retracement level soon, and it is around 148 and also happens to be its MA100. The upside resistance will be around 153.

In one word, the whole market is ready to test the 38.2% levels, it may bounce back from there to the level of last wednesday's rest area. For short term players, watch the market closely, if the market opens lower, wait until it hits the 38.2% level to buy. If the market opens higher or flat, it might also be brought down to the 38.2% level, also wait for the reversal signal to buy.

Again, 38.2% levels for Nas 1333 (-1.5%), Dow 11986(-1.05%), spy500 1371 (-1.15%).

Thursday, March 01, 2007


After testing its uptrend support line, RMBS bounced back strongly with decent volume today, to close above its MA50 and form a bullish reversal pattern (piercing ling). It has completely closed the gap of Feb.5. For next few days, more upside should be expected, with a near term resistance around 21.60-22.


AAPL showed extreme strength in today's bear market due to an upgrade call from Lehman brother. It closed just above its up move trendline. It will be interesting to watch if AAPL will continue to move higher or not, which will tell if todays movement is just an artifical trap set by the big guys or not. Upside resistance will be last high at 90.8, and downside support will be around 83.

Wednesday, February 28, 2007


LFC is on a downside channel and sits on the 50% retracement and low downside trendline as well. Looks like it is rebounce from the sell-off, near term target 43$.

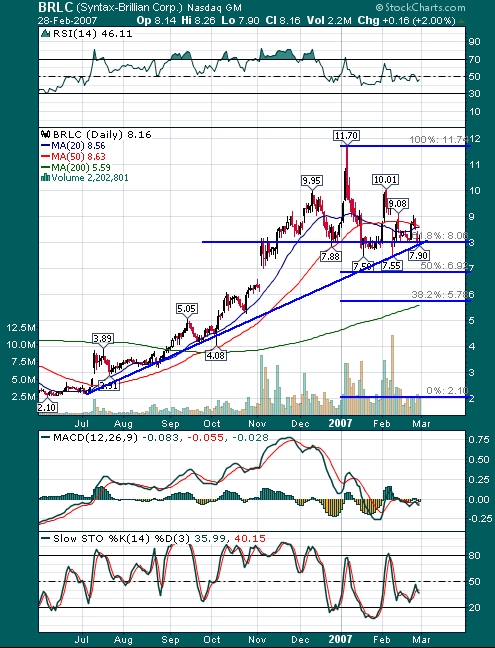
BRLC has been in a 3 months consolidation already, and it looks done with the correction, and earlier than the market. Rightnow, it sits on its 61.8% retracement
around 8$, which has been tested for 4 times and serves as a strong support
. The chance for broken down is slim comparing to an up side movement.


RMBS is still in its up channel. Today, it closed at it MA50 at 19.9$, which
is also the 38.2% Fibonacci retracement from the lastest run. The downside
risk is limited in regard to its upside room.


AAPL has to move up to its up trendline, otherwise, yesterday's damage will
become permanent for the near term market. The down side target is on its
MA200 or 50% retracement between its Jan07 high and July06 low, e.g. around
74$.

Tuesday, February 27, 2007


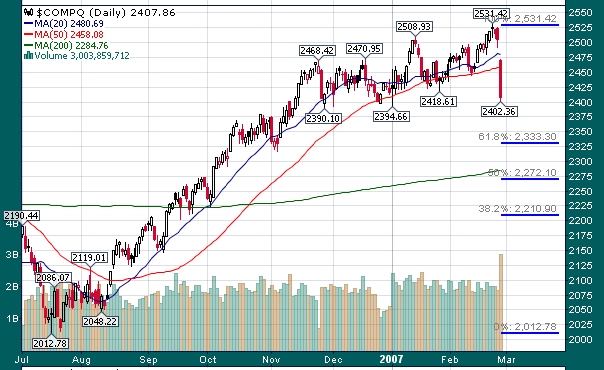
Nas closed @2407
MA50 2296 -4.6%
50% retrace 2274 -5.5%
38.2% retrace 2212 -8.1%
MA200 2075 -14%

Dow closed @12795
MA50 11715 -4%

Spy closed @146
MA50 133 -4%

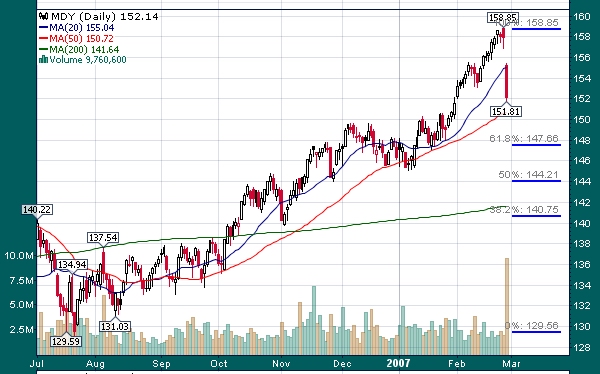
Mdy closed @ 158.8
MA50 142 -6.5%

Saturday, February 24, 2007

Earnings the Week
Mon.
BRCD0.13
CMGI
FMCN0.62

Teu
CMED 0.35
CYD
DYN -0.04

Wed.
JRJC0.03

Thru.
KSS1.43
DELL 0.29
OVTI 0.19

Fri.
KONG 0.08

Mar.8.
LMRA

Thursday, February 22, 2007


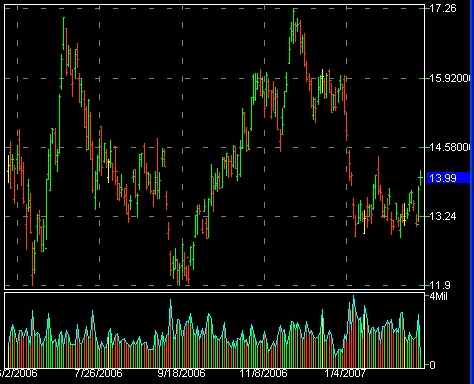
Bought HMY @ 13.99 at the opening.


1. bought Tra @market open @18.4, closed at 17.8
should waiting for pattern

Wednesday, February 21, 2007

Nitrigen

TRA AGU CF POT Industry
Market Cap: 1.68B 5.38B 2.12B 17.60B 1.65B
Employ­ees: N/A N/A N/A N/A 3.03K
Qtrly Rev Growth (yoy): -12.40% 16.80% 9.30% 9.00% 15.60%
Revenue (ttm): 1.84B 4.19B 1.95B 3.38B 2.83B
Gross Margin (ttm): 5.69% 22.32% 7.55% 29.86% 30.33%
EBITDA (ttm): 174.35M 451.67M 165.90M 1.10B 389.10M
Oper Margins (ttm): 2.68% 6.70% 3.66% 23.75% 5.96%
Net Income (ttm): -887.00K 33.00M 33.30M 631.80M 33.00M
EPS (ttm): -0.010 0.248 0.605 5.947 0.61
P/E (ttm): N/A 163.15 63.52 28.24 31.31
PEG (5 yr expected): 66.00 1.89 3.20 2.19 1.89
P/S (ttm): 0.90 1.26 1.05 5.18 1.67

TNH Market Cap: 883.05M
Employ­ees: N/A
Qtrly Rev Growth (yoy): 0.60%
Revenue (ttm): 425.10M
Gross Margin (ttm): 12.50%
EBITDA (ttm): 58.03M
Oper Margins (ttm): 10.47%
Net Income (ttm): 46.19M
EPS (ttm): 2.450
P/E (ttm): 19.29
PEG (5 yr expected): N/A
P/S (ttm): 2.25

Tuesday, February 20, 2007


With the prediction of a imminent movement for AAPL.
Set 4 Mar.85 Call @2.25 at the opening dip, 2 got filled.
Then set 4 Mar.80Put @0.6, got filled later.

The put order is questionable, should wait to the end of the day, because the market is really bullish for the whole day, Put closed @o.5$.

Monday, February 19, 2007

YTD CHINESE STOCKS
http://www.cnanalyst.com/2007/02/ytd_performance_10.html#more
1 TSL 93%
2 CBA 67%
3 CEA 53%
4 JRJC 53%
5 XING 46%
6 SVA 33%
7 TBV 32%
8 SOLF 25%
9 EDU 25%
10 FMCN 24%