USO roll, CL contango and etc.
.png)
.png)
.png)

here is an interesting article about USO roll:
How to Trade Oil ETF Volatility
http://seekingalpha.com/article/119327-how-to-trade-oil-etf-volatility
Keith Schaefer and Richard Reinhard
Few investors realize it, but the oil ETFs give investors a monthly opportunity to make day trading profits on senior oil stocks.
The United States Oil Fund (USO) is now so large, it contains more than 20% of the outstanding March crude oil futures contracts (West Texas Intermediate, or WTI). Now, being an ETF, it does NOT want to take physical delivery of that oil. So at some point each month – and that would be the 5th, 6th and 7th business days of the month – it rolls over their entire set of contracts to the next month – putting undue, abnormal pressure on the oil price those days. The Goldman Sachs Commodity Index does the same thing every month, but on the 6th, 7th and 8th business days. Roll dates are usually published in advance – USO provides theirs on their website.
BetaPro Horizons, which operates the Canadian oil ETFs, symbols HOU and HOD, say they roll over their Light Sweet Crude Oil Futures contracts on the 7th, 8th and 9th business days, but claim their holdings are so small compared to the other two that there would be no impact in the markets from their activity. Still, it would likely accentuate the already abnormal pressure.
Trading for the WTI contract is open 01:00 London (local time). The close is at 23:00 London time, except Monday morning when the open is 23:00 London time. In other words, well before stock markets open for trading, investors can see what the futures are doing, and will often react to their direction.
Savvy investors can potentially benefit from this event by buying senior oil stocks, whose performance tends to mirror the oil price almost exactly, with timely at-the-market orders, just as other investors react to the pre-opening WTI futures contract price down-tick as “forced” selling by these ETFs takes place. They can either do this ahead of the anticipated price pressure by selling their stocks at the close the day before, and/or by buying these stocks during the spike-down opening trade. Really aggressive investors may take advantage using the underlying options on these stocks - a tougher trade requiring precision timing and loads of experience.
As an example (refer to the 5-minute Candlesticks charts below), let’s look at the trading of Canadian Natural Resources (CNQ), a reasonably liquid Canadian producer of over 565,000 barrels of oil equivalent per day, with a $30 billion enterprise value. So, USO starts rolling over their contracts early on February 6, before stock markets open. CNQ had closed the prior day, February 5, at CAD$44.81. On the open February 6 CNQ is down sharply at $43.35, and bottoms at $42.55 within the first 5 minutes of trading, and within 15 minutes after the opening was back up to $44.62. It closed the day at $45.43.
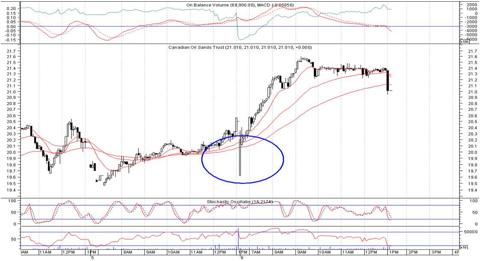
Canadian Oil Sands (COSWF.PK), another liquid stock that tracks the oil price, similarly started trading on February 6 down sharply at $19.62 after having closed at $20.50 on February 5. Within the first 15 minutes of trading it rebounded back up to $20.40. It closed the day up 51 cents at $21.01, with a high of $21.60.
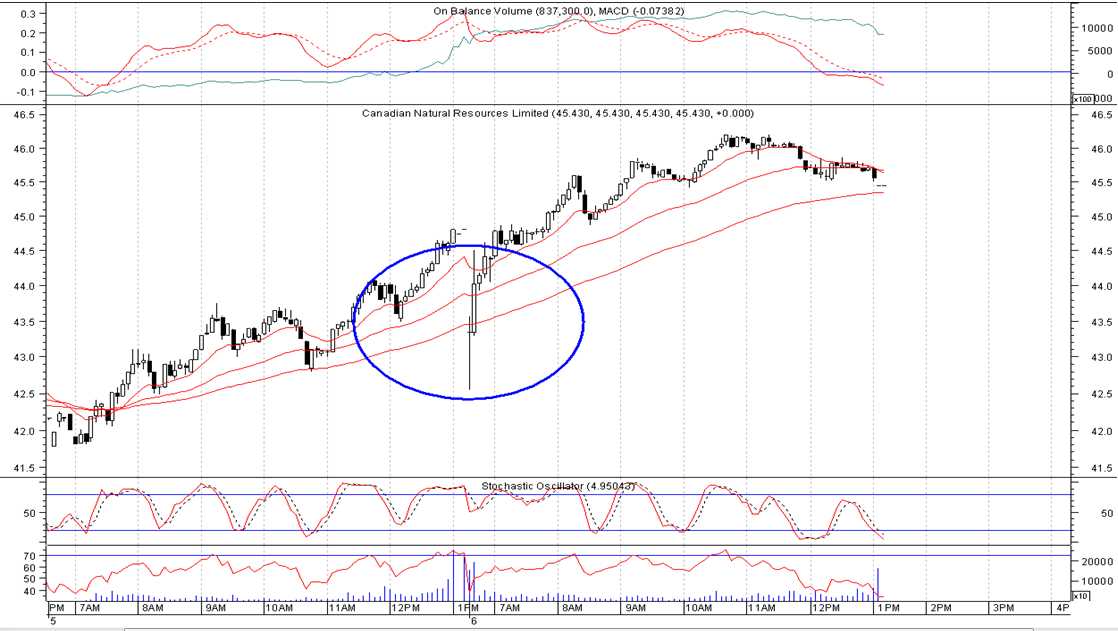
These gap-down-opens were undoubtedly caused by nervous investors reacting to the sharp oil price drop reflected by the pre-opening futures markets (albeit in conjunction with horrible, but expected jobless numbers).
These ETFs are getting very popular, and are so large that they are having an increasingly large impact on the market. Reuters reports that USO has increased in size 400% just since early December.
This is an example of the crazy derivative trading that Warren Buffett warned us about years ago, and what brought down the world’s financial system last fall (think CDS – Credit Default Swaps).
But this is our current reality. Obviously, this trade is for sophisticated and/or brave and/or crazy investors. But if you are a good day trader, it could represent an opportunity for quick profits.
.png)
.png)
.png)
.png)
.png)
