Saturday, March 03, 2007


GOOG seems a good Call play for near term. It closed at the 50% retracement of 538$, just filled the Oct.20 gap. Both CCI and Bollinger bands indicate a rebound is due. A down side support is the MA200 at 432, and up side resistance at 456$ or 38.2% retracement. Risk/reward ratio is 1:3.

If the stock opens low next monday, it would be a great opportunity to long.

Nasdaq closed at 2368 for the bloody week and lost 6.5% in 10 days. Next week,the index may test the 38.2% retracement at 2333 (1.5% drop) if going lower, and it can be done anytime soon next week. On the other hand, the index has been way oversold, and it can also go up anytime. If it does, the 1st upside resistance will be around 2400, which was roughly the support level during the consolidation period back to Nov-Dec of last year.


The Dow closed at 12114 and lost 5.3% from the peak. Looks like it's also imminent to test the 38.2% retracement at 11986 (1.05% drop). Upside resistance will be at 12354 area, which happens to be the MA100 level.


The SP500 closed at 1387, eyeing for 1371 at the 38.2% retracement.(another 1.15% drop). If the market does touch the 38.2% level, short cover is expected and will lead to a rebounce back to 1400 level.


Just like Dow and Nas, the Spy, now at 139, is also posing to test the 38.2% retracement at 137. If bouncing back, however, the resistance will be around 141 area, which is the MA100 level.


Mdy may also touch the 38.2% retracement level soon, and it is around 148 and also happens to be its MA100. The upside resistance will be around 153.

In one word, the whole market is ready to test the 38.2% levels, it may bounce back from there to the level of last wednesday's rest area. For short term players, watch the market closely, if the market opens lower, wait until it hits the 38.2% level to buy. If the market opens higher or flat, it might also be brought down to the 38.2% level, also wait for the reversal signal to buy.

Again, 38.2% levels for Nas 1333 (-1.5%), Dow 11986(-1.05%), spy500 1371 (-1.15%).

Thursday, March 01, 2007


After testing its uptrend support line, RMBS bounced back strongly with decent volume today, to close above its MA50 and form a bullish reversal pattern (piercing ling). It has completely closed the gap of Feb.5. For next few days, more upside should be expected, with a near term resistance around 21.60-22.


AAPL showed extreme strength in today's bear market due to an upgrade call from Lehman brother. It closed just above its up move trendline. It will be interesting to watch if AAPL will continue to move higher or not, which will tell if todays movement is just an artifical trap set by the big guys or not. Upside resistance will be last high at 90.8, and downside support will be around 83.

Wednesday, February 28, 2007


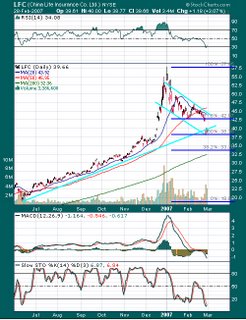
LFC is on a downside channel and sits on the 50% retracement and low downside trendline as well. Looks like it is rebounce from the sell-off, near term target 43$.

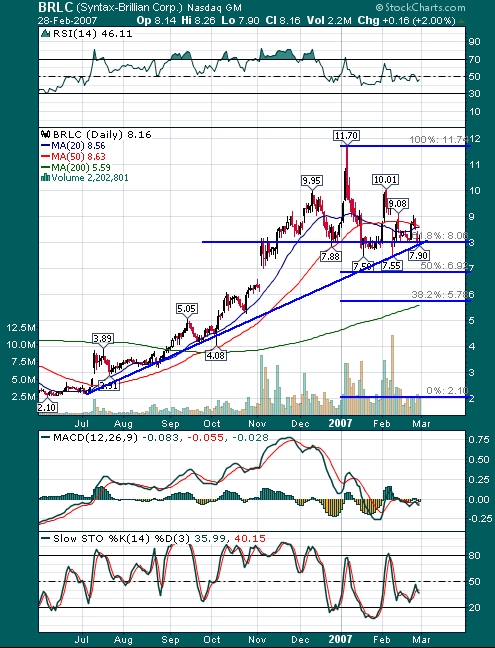
BRLC has been in a 3 months consolidation already, and it looks done with the correction, and earlier than the market. Rightnow, it sits on its 61.8% retracement
around 8$, which has been tested for 4 times and serves as a strong support
. The chance for broken down is slim comparing to an up side movement.


RMBS is still in its up channel. Today, it closed at it MA50 at 19.9$, which
is also the 38.2% Fibonacci retracement from the lastest run. The downside
risk is limited in regard to its upside room.


AAPL has to move up to its up trendline, otherwise, yesterday's damage will
become permanent for the near term market. The down side target is on its
MA200 or 50% retracement between its Jan07 high and July06 low, e.g. around
74$.

Tuesday, February 27, 2007


Nas closed @2407
MA50 2296 -4.6%
50% retrace 2274 -5.5%
38.2% retrace 2212 -8.1%
MA200 2075 -14%

Dow closed @12795
MA50 11715 -4%

Spy closed @146
MA50 133 -4%

Mdy closed @ 158.8
MA50 142 -6.5%