Tuesday, June 12, 2007

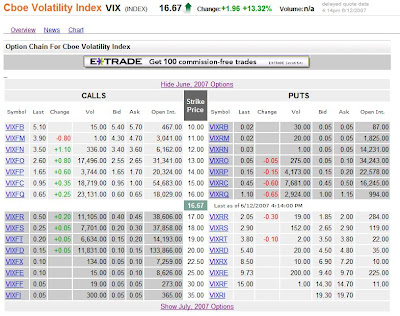
6-12-07 sector performance and Vix option


Sunday, June 10, 2007

Earnings of the week
Teu.
LEH 1.88 1.69 BMO

Thur.
ADBE 0.35 0.31 AMC
BSC 3.50 3.72 12:00PM
FRE 1.09 2.80 BMO
GS 4.79 4.78 BMO

Friday, June 08, 2007

Sector performance the day after sell-off


Utility solf off the hardest, but climbed the least
Technology sector seems the strongest in these 2 up/down days


Vix straddle view


Thursday, June 07, 2007

6-7-07 sell off and Vix spike


Vix and its option on 6-1-70


Wednesday, June 06, 2007

Stock traded higher in a big downday

crzo,hte,x,b,vsec,jci,ges,dltr,nile,aapl

crzo and hte are the rare standouts in the oil sector, up in up volume

x in steel sector is in new high, helped by JPM's upgrade

vsec and b are the leaders in the Aerospace/defense sector, and b was recommended by Cramer

jci in machinery sector was recommended by an analyst

ges, dltr and nile are the big winners in retailer sector

aapl, as always, just ignored the big market and moved in her own way.

Among other strong stocks are ice,crox, hpq,nvda,goog

Sunday, June 03, 2007

台湾股市泡沫是大陆的前车之鉴──台湾股市从泡沫泛滥到破灭的过程
香港《经济导报》2007年第22期朱磊/(提要)大陆股市狂升的情景,早在上世纪八十年代中期的台湾也出现过。当年由于台湾连续出现贸易顺差,大量外资涌入,迫使新台币大幅升值,造成股市和房市狂升不止,泡沫化严重。当局屡屡采取措施对应,并祭出了釜底抽薪的一系列办法,其后金融泡沫破灭,台湾经济也受到严重打击,彻底告别了经济高增长时代,遗患直至今时今日。台湾股市泡沫是上世纪八十年代中期,台湾出现连续贸易顺差,同时大量外资涌入,形成国际收支双盈余,迫使新台币兑美元汇率短短两年间大幅升值近40%,由于民间的投资机会和渠道有限,大量游资进入股票和房地产市场,引发股市和房市泡沫。从1986年台湾股价指数超过1000点,到1990年超过12000点,期间经历长达40个月的多头,而后股价开始狂跌,在不到八个月的时间内,股价跌落万点以上,到1990年10月1日,跌到2485点,造成台湾空前的泡沫破灭,并给台湾经济带来长期的负面影响。
......

Saturday, June 02, 2007

1. 止损,止损,止损!
2. 有疑问的时候,离场!
3. 忘掉你的入场价
4. 别频繁交易
5. 不要向下摊平
6. 别让利润变成亏损
7. 跟着股市走,别跟朋友走!
8. 该卖股票的时候,要当机立断,千万别迟疑!
9.别将“股价很低了”当成买的理由,也别将“股价很高了”当成卖的理由!
10. 定好计划,按既定方针办
11. 市场从来不会错,你自己的想法常常是错的

http://huarenbbs.com/showthread.php?t=488
Vix option

Long Vix with Credit:Sell (middle term) Put+Buy Call.

Risk: If vix stays under strike price for next few month (not likely!), you will lose the premium paid for the call.

Reward: If Vix spikes above the strike price, sell the Call and buy back the puts to lock profits.

Symbol Last Change Vol Bid Ask Open Int. Symbol Last Change Vol Bid Ask Open Int.
JUN
VIXFC 0.45 -0.05 1,647.00 0.40 0.55 47,046.00 15.00 VIXRC 2.05 +0.15 100.00 1.95 2.10 9,786.00

July
VIXGC 1.14 -0.06 78.00 1.10 1.20 28,996.00 15.00 VIXSC 1.90 -0.02 8,030.00 1.85 1.90 13,264.00

Aug
VIXHC 1.60 522.00 1.55 1.65 12,700.00 15.00 VIXTC 1.95 -0.05 300.00 1.90 2.10 5,184.00


Sept
VIXIC 1.95 +0.11 46.00 1.80 1.95 15,329.00 15.00 VIXUC 1.95 15,000.00 1.90 2.15 15,000.00
Zacks #1 Rank Top Performers:
FWLT, CRY, ASK,SNHY, DRYS

Friday, June 01, 2007

How to trade Vix


http://www.investopedia.com/articles/optioninvestor/06/NewVIX.asp

http://www.learnmoney.co.uk/spread-betting/news-nov-3.html

http://www.zealllc.com/2002/vix.htm

http://www.learnmoney.co.uk/spread-betting/news-oct-3.html

http://www.thestreet.com/options/options/10266389.html
... the primary players in these VIX options under "normal circumstances" will be call buyers or put sellers...


http://w3.quris.net/ebulletin/0702/SST_0702_OptionsCorner.jsp


http://optionsguy.financialblogs.com/post/blog/decoding_the_vix_ii.html
...VIX option is priced based upon the VIX futures contract , which is tradable, not the VIX index, which is not tradable....

http://www.theoptionclub.com/trading_vix_options.html

http://vixandmore.blogspot.com/search/label/CFE


when the VIX jumped 64% from February 26th to February 27th, the nearest futures, the March ’07 VIX, moved less than half as much in percentage terms. Looking further out, the August ’07 VIX futures moved about one tenth of the VIX index, while the November ’07 VIX futures moved about one thirtieth as much as the VIX did.


Margin requirement:


Margin:Purchases of puts or calls with 9 months or less until expiration must be paid for in full. Writers of uncovered puts or calls must deposit / maintain 100% of the option proceeds* plus 15% of the aggregate contract value (current index level x $100) minus the amount by which the option is out-of-the-money, if any, subject to a minimum for calls of option proceeds* plus 10% of the aggregate contract value and a minimum for puts of option proceeds* plus 10% of the aggregate exercise price amount. (*For calculating maintenance margin, use option current market value instead of option proceeds.) Additional margin may be required pursuant to Exchange Rule 12.10.


For example,


1. if sell 13 put (of vix at 14) for 0.4: 0.4x100+(14-13)x100x15%=235, and 5k can sell 21 puts.


2. if sell 20 call of (vix@14) for 0.4: 0.4x100+14x100x10%=180, and 5k can sell 27 calls.


Vix on wikipedia.org


Vix White book http://www.cboe.com/micro/vix/vixwhite.pdf


Risk: there 2 of risk. one is OE vix price, which has a risk to trade over or below the strick price of sold call or put. this can be well controlled by only selling option deep OTM, for example, call above 25, put below 13 (or 40% away from current Vix). For the past year, there had never been a case for vix ended higher than 18 in OE day. So it may be safe to sell call with strike price over 19. but still need to be agile in watching vix. on the low price end of vix for put, it's more predicatible according to the current market performance.


the 2nd risk is margin maitance risk. I had lost half of my account value by not knowing enough of this risk. this is like a monster who can completely ruin your yard if you let him out of control!

Qs

Wednesday, May 30, 2007

ASTI
need to solve this problem, stop at 7$!

Payable Ex Date Company Symbol Optionable? Ratio Announced Add To My
Calendar

--------------------------------------------------------------------------------

May 04 May 07 AZZ Inc. AZZ N 2-1 Apr 09
May 09 May 10 AptarGroup ATR N 2-1 Apr 18
May 11 May 14 Meridian Bioscience VIVO Y 3-2 Apr 19
May 21 May 22 IDEX Corp IEX Y 3-2 Apr 04
May 22 May 23 Brookfield Pptys BPO N 3-2 Feb 07
May 25 May 29 Atlas America ATLS N 3-2 Apr 27
May 28 Gildan Activewear GIL N 2-1 May 03
May 29 May 30 Potash POT Y 3-1 May 02
May 30 Tesoro Petroleum TSO Y 2-1 May 01
May 30 May 31 FEMSA FMX Y 3-1 May 16 Add
May 31 Varian Semi VSEA Y 3-2 Apr 24 Add
May 31 Jun 01 Geo Group GEO Y 2-1 May 01 Add
Jun 01 NRG Energy NRG Y 2-1 May 02 Add
Jun 01 Stericycle SRCL Y 2-1 May 17 Add

http://biz.yahoo.com/c/07/s5.html?tso

Sunday, May 27, 2007

Naz: resistance, 2580
support, 2531

qqqq: resistance, 46, 45.5
support, 47

Dow, support 13340

Saturday, May 26, 2007

This summary is not available. Please click here to view the post.

Thursday, May 24, 2007

Stocks withstood the storm of 5-24
NTRI,WEN,ESRX,WCG,CRH,ACL,AMZN,UAUA,RIMM

MITBBS psp swing short/long list for 5-25
AFFX,KBH,LEN,WCI,VMC,dj

Tuesday, May 22, 2007

Friday, May 18, 2007

Tuesday, May 15, 2007

Sunday, May 13, 2007

Earnings of the week
RNO0.19
SINA0.18
TBSI0.40

AMAT0.28
CPWR0.17
DCX0.93
FIGN/A
HD0.59
JASO0.17
KALU1.07
MR0.11

MT1.43
BEAS0.12
DE2.41
FD0.20
HPQ0.68
CRM0.08
SPTN0.28

FMCN0.19
JCP1.03
KSS0.62
MRVL0.09
JWN0.56

Tuesday, May 08, 2007

AKS story

Yesterday,bot 250 shares of AKS @ 32.36 in the morning when it broken the previous day's high at 32.25(also 52 week's high), but the stock then traded sideway for the rest of the day and closed at 32.06. I didn't sell the stock as it didn't break down and still showed some strength.

This morning, I found there was buyout news about AKS, and the stock was trading around 38.5-38.8 BH by the time I opened the computer. Wow, this was like a lottery. Then I checked GOOGLE BH chart, and found the stock was ever traded up to 39.5, and the news said the buyout from MT offered about 40$ a share. My mind was flying, and was full of hope that the stock may go higher again, but never ever think about the speclative nature of such news and the downside risks from here. The stock slided gradually BH and opened at 37.5, I just watched it slided into 35 area. Around 11AM, I set up a stop limit order at 35.2/35.2 and left for the day. When I came back around 4PM and found my shares were sold as expected. The market closed at about 35.

Lessons: 1. It should be sold BH at ask price around 38.5. Because it has risen so much and the news has not confirmed yet by both parties, and it may have a long way to go. Another possibility is this could be just a rumor as yhoo had with msft a few days ago.
2. 38.5 is not that far from the alleged offering at 40$, and usually there will be some time value left for the stock to trade up before the final close of such a deal.

3. when the market opens, I should set a tight stop limit order, at least above 37, to protect the values already gained.


Monday, May 07, 2007

ATI(111.77) looks particular hopeful in short term, June 120 call 2.5 would be reasonable!
Sector Snap: Titanium Producers

Friday, May 04, 2007

ER watch of the week

EGLE0.29
JCOM0.32
NFG0.87
WCG0.55
WYNN0.55

BRNC0.53
CSCO0.33
DBN/A
DYN0.03
FTEK0.06
HOC1.07
PCLN0.28

GSS-0.01
LM1.17
SPH2.79
TM2.13
TXU1.11
UBB2.05

AIG1.54

ALU-0.01
VOLV1.41

Wednesday, May 02, 2007


Sold the may 125 call @7.8(bot @5.4 two days ago)

Tuesday, May 01, 2007


Ideal Rebounce play of the day: CME


Techinically missed this rebounce, but in the afternoon, entered May 520 call @8.8 in Paper trading(stop order 7.6, bot @8.8, not quite understood?)


Tomorrow, will keep watch it closely as it closed below EMA200!

Monday, April 30, 2007


TSO had a pretty good run today, the may 120 call hit 8.5 at noon. But in the afternoon, it also retreated sharply with the whole market.


Should sell the call when the stock broke down the support around 124.5! But why didn't? Because I thought it would be up again, however, this is just a hope and merely hope, though it will report earning on thur. In fact, it has already made a crazy run, and it is time to have a break. Another thing, I should keep in mind is, the target is set to reach 128 before the final OE week, and today it has reached 126, the option value should have been equally realized! why not seeing this?(eventually, I sold 1 call near close around 5.4 by considering don't let the profit runs into a loss!)


Tomorrow, if the market opens with berish sentiment, sell the other call!

Saturday, April 28, 2007


Bear Spread
1. buy Jun60 put @~2.55/sell Jun52.5put @~0.8/while stock @62.6

DNDN straddle view
1. buy Jun 15 call @~5.20, while stock @15.15

Friday, April 27, 2007

Earnings of the Week

AHM 0.46
ROCMN/A
VZ0.54
XFMLN/A

GMR0.69
OIS0.99
PG0.74
SIRI-0.11
SOHU0.14
SPAR0.30
UNTD0.25

GRMN0.59
GNSS-0.30
HP0.82
ICE0.72
JDSU0.10
LVS0.32
RNWK0.17
SUN1.39
SYMC0.20
TWX0.20
VRSN0.22

CNQ0.98
CELG0.20
RIO1.05
FFH6.00
FE0.81
GM0.87
NBL1.01
OMX0.93
OMG0.84
QLGC0.23
SIMG0.05
TSO1.87

AU0.36
FIRE-0.23
TS0.88
WPO8.64
RealMoney.com Contributor 4/24/2007 7:45 AM EDT


2nd link here

Thursday, April 26, 2007

股市还是晴雨表吗?(ZT)
2007年04月26日

人们一直有股市是经济增长晴雨表的说法,不过,近几年来,这只晴雨表的准确性实在不怎么样。从2004年初到2006年一季度,美国经济实现了平均增幅3.4%的不俗业绩,而这期间道琼斯工业股票平均价格指数只上涨了6%。从那之后至今,经济增幅放慢到略高于2%的水平,而道指至昨天的升幅却达到了18%,收于13089.89点,这也是该指数第一次收在13,000点之上。

那么,股市走势到底是对经济增长前景的反映呢,还是与经济增长毫不相干?经济学家对此莫衷一是。美林公司首席北美经济学家戴维•罗森伯格(David Rosenberg)认为,当前股市出现了一种误导性的乐观。他说,经济表现和股市走势之间出现了脱节现象。刚刚过去的四个季度里,美国经济折合成年率的增幅连续低于3%,而从过去60年的经历看,这种情况之后都会接着出现衰退。虽然罗森伯格并未预言会有衰退,但他认为出现衰退的风险要高于市场的一般看法。

而纽约投资银行ISI Group首席经济学家埃德•海曼(Ed Hyman)则属于另外一派。他认为,股市(在反映经济形势方面)的表现无可指责。1985年和1995年的时候,联邦储备委员会(Fed)将利率上调到足以抑制经济增速、控制通货膨胀的水平。投资者相信,此后不需要再进一步上调利率了,过高的利率将有可能将经济推向衰退。海曼预计,今年余下的9个月,经济增长将进一步放缓到折合年率1.5%的水平,Fed相应地将把基准利率下调75个基点。他说,利率下降对股市的推动将大于经济增长放缓和企业利润下滑对股市的负面影响。目前来说,股市并未对近期的企业利润情况作出反应。实际上,企业利润增幅一直在大幅下滑,同时,美国生产率增长放慢、能源价格居高不下和可能阻碍全球化的贸易保护主义思潮更给经济前景蒙上了阴影。实际上,股市从去年夏季开始的上涨行情主要是受Fed停止加息的刺激。

长期以来,股市一直都被视为一种领先经济指标,尽管有时股市发出的信号并不准确。股市走势是数百万人对企业利润前景的各种不同判断的综合结果,而企业利润对经济波动非常敏感。不过,其他一些因素也影响着股市,比如利率、进出股市的资金、投资者对风险的承受意愿等等。由于多种因素影响股市,因此,专家们对股市与经济形势的关系往往有不同的解读。ISI的海曼说,通常认为的强劲的股市需要有强劲的经济作支撑的看法完完全全是错误的。他说,上世纪八十年代初以来,Fed采取了在预见到将出现通货膨胀压力时、也就是在经济扩张阶段的早期就提前上调利率的做法。这种“先下手为强”的紧缩措施的确抑制了经济增长,但它防止了更深程度的通货膨胀的爆发。在紧缩阶段,即使企业利润还在增长,股市上涨也会很困难,因为投资者担心Fed会在加息道路上走得太远、进而有可能将经济推向衰退。一旦Fed停止加息,投资者会认为既然通货膨胀已得到控制,那么衰退也就不大可能,股市会重新开始放开手脚。

Fed并不总能保证利率调整的成功。1990年和2001年两轮加息后就伴随着衰退。不过海曼以英国、澳大利亚和加拿大为例指出,这些国家自九十年代初以来就在持续增长,基本未发生中断,这表明,只要通货膨胀保持平和,长期的经济增长仍是有可能的。他说,从现在的情况看,美国还处于温和通货膨胀的状态。不过,美林的罗森伯格看法有所不同。他说,八、九十年代的情况是特例,他还认为,现在没有什么特别因素能像前两次经济快速增长时的减税和互联网热那样大大推动经济增长。世界大企业联合会(Conference Board)领先指数已连续三个月出现较上年同期下降的情况,而同期股市却在上升。股市本身也是大企业联合会领先指标的成分要素之一。罗森伯格说,在过去60年时间里,每当出现这种情况时,之后都会有衰退发生,其间只在1967年发生过一次例外。目前,在大企业指数中显示衰退迹象的因素有资本商品订单和建筑开工许可以及短期利率高于长期利率。

还有其他一些迹象也显示出经济增长盛极而衰的苗头。比如Fed前主席格林斯潘(Alan Greenspan)就提醒大家注意毛利率的问题。从经济整体范围来看,去年三季度的利润率升到了创纪录水平,随后四季度开始小幅收窄。格林斯潘认为,上世纪八、九十年代的经济增长受到了长期利率下降和九十年代生产率受信息技术推动意外地加速上升的影响。而现在,这两个因素都已不复存在。花旗集团(Citigroup Inc.)经济学家斯蒂芬•魏廷(Steven Wieting)说,自从2001年年底以来,股市走势一直落后于企业利润增长。据他估计,投资者对美国经济长期增幅的预期在2%-2.5%,而许多经济学家预计的增幅约为3%。他说,市场对美国经济长期增长前景并无很高期待。Greg Ip

Monday, April 23, 2007

ER to watch

IMCL 4/26
GERN 4/27
TSO 5/3
BRLC 5/15

Sunday, April 22, 2007

Weekly ER

AMGN1.08
JDAS0.24
JNPR0.19

AKS0.45
AL 1.47
AMZN 0.15
T 0.61
BP 1.31
CME 3.62
IPS 2.60
X 1.85

AMAG -0.59
AKAM 0.28
ATI 1.83
AAPL 0.64
GLW 0.26
ISE 0.45
RMBS 0.10

BZH -0.14
BRCM 0.27
CF 0.65
CENX 1.95
CFC 0.78
XOM 1.51
SNDK 0.18
VLO 1.76

BIDU 0.33
CCJ 0.14
CVX 1.66
GT -0.02

Friday, April 20, 2007

Steel Could Be the Next Victim
DT pattern of AVRN

Diabetic drug news released BH, the stock then was traded more than 100% higher. After checked the chart, found it shows a decline from 10s for last year, and it also has large short ratio. So I concluded this stock was going to have a huge move, as it showed fr0m 2 to 6 !


Hourly chart

Monday, April 16, 2007

股市顶尖高手的六大法则(ZT)


法则一:买股票前先进行大势研判(剖析主流资金真实目的,发现最佳获利机会!)
1、大盘是否处于上升周期的初期。
2、宏观经济政策、舆论导向有利于哪一个板块,该板块的代表性股票是哪几个,成交量是否明显大于其它板块。确定5-10个目标个股。
3、收集目标个股 的全部资料,包括公司地域、流通盘、经营动向、年报、中报,股东大会(董事会)公告、市场评论以及其它相关报道。剔除流通盘太大,股性呆滞或经营中出现重大问题暂时又无重组希望的品种。

法则二:中线地量法则(独家证券内参,365天资讯情报站……)
1、选择(10、20、30)MA经6个月稳定向上之个股,其间大盘下跌均表现抗跌,一般只短暂跌破30MA。
2、OBV稳定向上不断创出新高。
3、在大盘见底时地量出现,以3000万流通盘日成交10万股为标准。
4、在地量出现当日收盘前10分钟逢低分批介入。
5、短线以5%-10%为获利出局点。
6、中线以50%为出货点。
7、以10MA为止损点。

法则三:短线天量法则
1、选择近日底部放出天量之个股,日换手率连续大于5%-10%,跟踪观察。
2、(5、10、20)MA出现多头排列。
3、60分钟MACD高位死叉后缩量回调,15分钟OBV稳定上升,股价在20MA之上走稳。
4、在60分钟MACD再度金叉的第二个小时逢低分批进场。
5、短线获利5%以上逢急拉派发。
6、一旦大盘突变立即保本出局,以利再战。

法则四:强势新股法则
1、选择基本面良好、具成长性、流通盘6000万以下新股观察。
2、上市首日换手70%以上。或当日大盘暴跌,次日跌势减缓立即收较大阳线,收复首日阴线2/3以上。
3、创新高买入或选择天量法则买点介入。
4、获利5%-10%出局。
5、止损设为保本价。

法则五:成交量法则
1、成交量有助于研判趋势何时反转:高位放量长阴线是顶部的迹象,而极度萎缩的成交量说明抛压已经消失,往往是底部的信号。口诀:价稳量缩才是底。
2、个股成交量持续超过5%,是主力活跃其中的明显标志。短线成交量大,股价具有良好弹性,可寻求短线交易机会。
3、个股经放量拉升、横盘整理后无量上升,是主力筹码高度集中,控盘拉升的标志,此时成交极其稀少,是中线买入良机。
4、如遇突发性高位巨量长阴线,情况不明,要立即出局,以防重大利空导致崩溃性下跌。

法则六:不买下降通道的股票
1、猜测下降通道股票的底部是危险的,因为他可能根本没有底。
2、存在的就是合理的,下跌的股票一定有下跌的理由,不要去碰它,尽管可能有很多人觉得它已经太便宜了。

Sunday, April 15, 2007

Stock price change for AMD and INTC after their ER day!

Seems there aren't much correlations for the price change to other's ER.
So it might be ok to wait for INTC's earning on Tue. before enter strangle position for AMD.

The ideal play here would AMD May 14 Call/13 Put. If AMD doesn't move a lot as expected after ER, close the position imediately. If it moves huge on one direction, we either take profits for the comb or just do for the up side and wait for a dead cat bounce for the down side, but be careful!

Friday, April 13, 2007

今天又很失败!

发现DYAX带量break,设limit order 6.3, 涨太快,错过了,再设market order, 6.635进.很快涨到6.95没出。唉,这不是那谁说过的,这种爆涨的情况,定Target主要要看整数。过6.95,冲7失败,就应该出,为什么没有呢?当DYAX回头,形成第二峰,出现lower high 的pattern,这时无论如何都因该出了。可是还是没有出,为什么呢? 总觉得,它还会涨回来。明显是在trade hope 么! 老毛病了。

不过,DYAX回落到38.2%Level后,就一直在横盘整理,希望下周一再蹦达一下。把丢失的hope给踹回来!然后,得停一段,不要做DT,时间精力都搭不起。


Thursday, April 12, 2007

DNDN tomorrow!


IMCL 10 days intraday: right shoulder?


AAPL support: 90.39/89.92/88.278

Tuesday, April 10, 2007

Nickel's rally is molybdenum's gain

Nickel prices on the London Metal Exchange have climbed more than 200% in the past year and some of their success has been spilling over to molybdenum...
IS it the time to retrace a bit?


Monday, April 09, 2007

Real Story:Cancer Drug Mania
DNDN CEGE PCYC
Stem cell : Stem cell vote set for Congress this week

在MIT贴过这个新闻,好像没什么人感兴趣。收集了几个STEM CELL的STOCK.
Adult stem cell: OSIR ,CYTX , ASTM ,STEM,以及
Embryo stem cell:GERN
今天大多都表现不佳,看来对VOTE的期望不高!
But it might be a good approch to buy GERN straddle.

Sunday, April 08, 2007

FRG broke out!


Jade on support trendline, if holds, buy!