Saturday, March 24, 2007


double bottom revers pattern

FA: 1. Thur. the unexpected increase of Feb home sale couldn't boost the market further, which indicates the market itself might be saturated with good news
2. Oil price will be a concern with Iran issue comes into play

TA: 1. the target of the W pattern has been reached, and a possible lower low and lower high downtrend channel is forming!
2. in a long term the correction hasn't done yet, until all indices touching weekly EMA200, and also only 3 weeks duration for this so-called correction is unusally short.


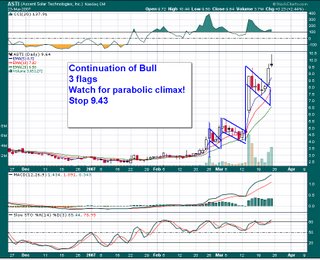
7 month chart
Target EMA100 at 3.61
stop EMA50 at 2.09


watch out for formation of
parabolic patter

Thursday, March 22, 2007

Tuesday, March 20, 2007

Saturday, March 17, 2007


Naz 2373
Resistance: 2405 (EMA20)
Support: 2332 (38%)


Spx 1387 .
Resistance: 1405(EMA20)
Support: 1365 (38%, EMA200)


Dow 12110 .
Resistance: 12295 (EMA20)
Support: 11950 (38%,EMA200)

Amateur

Friday, March 16, 2007

Notice CME around 3PM when the stock traded around 520$, and both Mar520 Call and Put traded around 1$. The stock has fallen a lot for the day, and I was thinking it might close at 520$, BUT forgot one fact that what the real market is telling us.
Look at the chart, after forming a double bottom, the stock bound back beautifully from 520 to close above 525, while the Call option closed at 5.10.
So technical analysis is always the basis for trading, just follow the trend, do let other preset-mind lead you.

Thursday, March 15, 2007

Wait For Follow-Through Day Before Buying
Mistakes 1:

For the first several minutes, market opened slight up and starts to climb, then I jumped in for 10 May QQQQ call at 1.56. This is stupid, as I already predicted the market is going to be quite as we approch the OE day. But once I saw the Q climbing, I felt I should buy some calls to compensate my Puts. And denied the fact that the market didn't have momentum to go up today, so I bot the call at the highest price, though the stock came back to 43 level but the call never came above 1.56...

Have to sell tommorrow!!
1. if market opens higher, sell,
2. if market opens flat or lower, wait for chance to sell

Mistake 2:
before the close, saw somebody mentioned usna on mitbbs, which down 15% for rumor on their health products, then jumped in bot April 50 Put at very high price 3.7. The option closed at 3.4. If the news went away, the option will drop more even if the stock keeps falling.

Don't let emotion or gambling feeling dominate you, keep calm always.

Plan: 1. if solf the Q call, prepare to buy some index puts
2. buy some double short EFT for the IRS account.(sold Q call and bot some qid for irs)

Wednesday, March 14, 2007

QQQQ pivot point
43.22
42.66
42.32
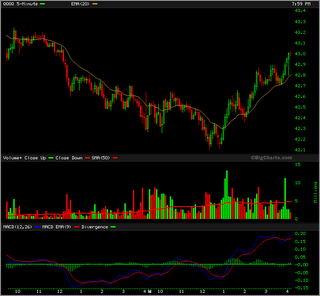
QQQQ formed a beautiful double bottom at noon and rebound in another beautiful extended w. Today, I was totally insentitive to the market, and stick to my ego, that the market is going down. I exited half April 143 put at good profit, but the profit for the remaining was eaten away. The mistake I made is I bot some May 143 Put too early..., should check the whole market and wait....


Spy has similar pattern. If I am sensitive enough, should also quit from the May Put.
Yesterday bot Leh April strangle. This morning both put and call opened lower than yesterday's close due to the relief of its high valatility after the earnings. Leh slided below 68, the put increased to 4 (bot at 2.1), in any case should take profit for the put here, but I didn't, still hold both put and call.

The lesson, if one side option got double in a short time, should take profits!!!

Sold GOOG April 390 Put @ 2.4 for break even when GOOG stayed around days' bottom 440, a good step. Because GOOG has reached its short term bottom again, and this put is too deep out of the money, the decay will accelerate next week.

Tuesday, March 13, 2007

Spy
Support 137.35 (last low)
136 (EMA200)
Resistance 141.4 (last high)

QQQQ
Support 42.16 (EMA200)
41.9 (last low)
Resistance 43.24 (last high)

Leh
Support 70-70.5 (last low)
67
Resistance 76.63(last high)

Saturday, March 10, 2007

Earnings of the Week

Mon
ACH
MR0.13
STP0.20

Tue
GS4.90

Wed
GM1.19
LEH1.95
JUPM0.06

Thur
BSC3.80
BONT4.56
Big Picture of the Martket


Near term support (EMA200) and Resistance (EMA20)
Dow 12276 12381 <---> 11950
Naz 2388 2423.6 <---> 2340
Spx 1403 1415.5 <---> 1366

Big Picture

AAPL PUT play for OE week

Price as 3/9/07 for aapl put
Strike Mar April
85 0.3 1.85
90 2.4 4

1. buy April85Put 1.755 (27.85% volatility) then
Fri.85 2.74 56%
Fri.90 1.05 -40.2%
Gain/loss: 1.39:1

2. April90Put 3.92 (26%)
85 5.74 46.4%
90 2.69 -31.4%
Gain/loss: 1.48:1


3. Mar90Put 2.24 (22.5%)
85 5 118%
90 0 -100%
===========================
GOOG 452.96, April 450 Put Fri. 14.5 IV 27.7%

Mon GOOG452.96, 14

Fri.GOOG440, 19.6, 40%
Fri.GOOG450, 14.4, 2.8%
Fri.GOOG460, 10.27, -26.6%

Friday, March 09, 2007


Evidence of stock price clustering at strike price.

For the past year at every month's OE day (vertical cyan grid),both AAPL and GOOG tended to close at strike price (horizontal grid). If AAPL and GOOG can be manupulated on such a degree of precision, let alone other small cap stocks.

Let's just wait for a week, see where AAPL and GOOG ends up on Friday?

Thursday, March 08, 2007

Today closed RMBS Mar.20 Call at 0.7, take heavy loss!!!

Bought
4 SPY May 140 Put at 2.7
20 QQQQ April 43 Put at 1.035 (average of 1+1.07)
39 QID at 55.157

Option seems relatively expensive during the opening session of the market, this high volatile time should be avoided for buying options if not for day trading. Early afternoon seems a better time for entering option order, when the market become stable and bored.
NAS 2389,
Resistance: 2406 (EMA100)-2414(38.2%); 2438(EMA50)
Support: 2344(last low, EMA200)

Dow 12261
Resistance: 12283(EMA100)-12328(38.2%); 12438
Support: 12039(last low), 11989(38.2%), 11948(EMA200)

SPX 1402
Resistance: 1403(EMA100)-1407.5(38.2%); 1421
Support: 1371(last low) 1374(38.2%) 1365(EMA200)


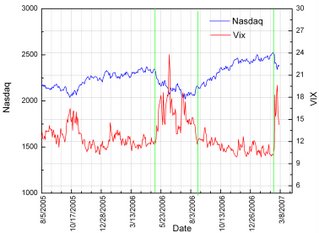
Nasdaq vs ^VIX curve, watch the price drop on the index and the uprising on the VIX

Tody, Mama opened high in huge volume due to its strong earnings.

Entered at 6.08 in 2nd up waves, then it made a high at 6.2 and another higher high at 6.22, then it retrace backe and made a lower high 6.16. This is a strong signal for exit. Should get out around 6.05. however, I just ignored the signal and until it broke down around 5.9, out at 5.84, lost 0.22 cents.

Never ignore the market signal, don't trade on hope!!!!