Monday, September 12, 2011

Inverse Vix ETN

http://etfdb.com/2011/inverse-vix-etns-reviewing-all-the-options/


Inverse VIX ETNs: Reviewing All The Options

by MICHAEL JOHNSTON on JUNE 23, 2011 | ETFs Mentioned:  •  •  •  •  • 
As the lineup of ETFs approaches the 1,300 mark, a growing pool of issuers continue to deliver innovative new products that tap into strategies and asset classes that have never before been accessible through the exchange-traded structure. One relatively new area that has attracted billions of dollars in new assets in recent years is the volatility space; there are now 15 ETPs in the Volatility ETFdb Category with aggregate assets of nearly $3 billion.
The development of volatility ETPs has been an interesting illustration of the increasingly wide reach of the ETF industry. Unlike stocks and bonds, a direct investment in volatility isn’t possible; the relevant values are derived from prices of other securities, and it isn’t possible to simply go out and buy volatility. Because volatility tends to move in the opposite direction of equity markets, the idea of transforming this metric into an investable asset had obvious appeal to investors looking to bet on a spike in anxiety or to use as an efficient hedging tool in connection with more advanced short-term strategies [see Reviewing All The VIX ETF Options].
The development of futures and options linked to volatility contracts made such an investment possible–at least for those with the ability to trade and monitor positions in derivatives. The packaging of those securities within the exchange-traded wrapper wasn’t far behind, and that innovation made establishing exposure to volatility as easy as buying shares of GOOG or MSFT.

Appeal Of Inverse VIX

The first VIX ETNs offered long only exposure to an index comprised of futures contracts, and these products quickly became popular among short-term traders as instruments for hedging equity positions or speculating on short term swings in stocks. It didn’t take long for anyone using the VIX products over a longer time period to get a feel for the impact of the futures-based strategy on bottom line returns.
VIX futures markets are often in a state of contango, meaning that long-dated futures are more expensive than those closer to expiration. At the short end of the maturity curve, that contango can be quite steep. That means that the “roll yield” incurred when selling expiring contracts to buy up next-to-expiration futures can be hefty, creating a significant gap between a futures-based VIX ETP and the hypothetical return on a spot investment in the VIX (which isn’t possible).
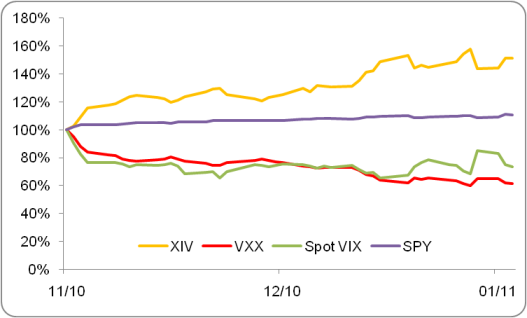
Last year the iPath S&P 500 VIX Short-Term Futures ETN (VXX) lost more than 72% of its value, a massive decline compared to the more modest 18% dip in the spot VIX.
More recently, a number of ETNs have debuted that effectively give investors a tool to exploit the structural inefficiencies in VIX futures markets that accounted for that huge discrepancy. These inverse VIX ETPs essentially allow investors to play the role of the insurance company, selling portfolio insurance with a relatively high premium. If the big one hits–like it did in 2008–these products are likely to get pummeled by a surge in volatility. But if measures of volatility hold steady or even rise modestly, the wind at the back of these products gives investors a potentially compelling return enhancement mechanism [Inverse VIX ETNs: Free Money?].

Inverse VIX ETNs

Those looking to establish inverse exposure to the VIX and profit from the same contango that cripples long-only funds over the long run have a number of options to choose from. And while there are some general similarities, many of these inverse VIX ETNs are quite different from one another [sign up for the free ETFdb newsletter]:

VelocityShares Daily Inverse VIX Short-Term ETN (XIV)

This ETN is perhaps the most efficient tool available for those looking to profit from the steep contango in VIX futures markets. XIV seeks to deliver daily results that correspond to the inverse of an index made up of short-term futures contracts. That focus means that XIV is often hammered when volatility spikes, but should perform well during periods of falling or even flat volatility. Because XIV seeks to deliver the inverse of a futures-based index, it isn’t uncommon for this product to rack up gains during periods in which the spot VIX actually climbs.
It’s important to note that XIV resets exposure on a daily basis; that frequency can have a significant impact on the risk/return profile of this fund. Investors with a holding period of longer or shorter than a day may experience returns that vary from the target -1x multiple, and the compounding of returns can work either for or against investors.
Since its launch in November of last year XIV has gained nearly 70%, making it one of the top ETP performers over that stretch. The spot VIX has declined by about 15% during that same stretch, illustrating the potentially powerful benefits to shorting a strategy facing stiff headwinds in the form of consistent contango [Five ETF Strategies For A Sideways Market].

VelocityShares Daily Inverse VIX Mid-Term ETN (ZIV)

This ETN also offers inverse exposure to an index comprised of VIX futures, but focuses on a benchmark comprised of securities with a longer time until maturity. The related index has a constant weighted average maturity of five months, which reduces both the volatility and the impact that the slope of the futures curve has on calculated returns. So ZIV will generally experience both single day and multi-period price swings that exhibit near perfect correlation to XIV, but with less volatility. For investors looking to tap into the inverse VIX investment thesis with less substantial risk in the event of a stock market collapse, ZIV can be a useful tool [Talking VIX And Volatility ETPs With Nick Cherney].

iPath Inverse January 2021 S&P 500 VIX Short-Term Futures ETN (IVO)

This ETN also offers inverse exposure to an index comprised of short-term VIX futures, as IVO and XIV are linked to the same benchmark. But this iPath ETN strives to achieve this objective over the term of the note (as opposed to over the course of a single trading session). Launched in early 2011, IVO matures ten years later; that period represents the period over which IVO will deliver inverse exposure [see Reviewing Three Types Of Leveraged ETFs].
So as the underlying index moves, the effective exposure offered varies as well. Just as products like XIV and ZIV will only achieve their target multiple over the course of a single trading day, IVO will only achieve its target objective over the course of the note. Those getting into this product somewhere along the line are likely to achieve results that vary considerably from the target multiple of -1.0. Currently, the participation value for IVO  is 0.62, indicating that a position established now will only experience a fraction of the inverse movement in the underlying index between now and maturity.

iPath Barclays ETN+ Inverse S&P 500 VIX Short-Term Futures ETN (XXV)

XXV debuted in July 2010, and the notes mature in July 2020. Since this ETN launched the underlying index has plummeted, thanks in no small part to persistent contango in VIX futures markets. The steep decline has had a couple of effects on XXV; this ETN has performed quite well, gaining close to 75% over the last year. That run-up has also diminished the participation ratio significantly, meaning that investors buying in now won’t experience long-term returns that correspond to -100% of the underlying index.
Recently XIV’s participation ratio was just 0.13, indicating that the movement in this ETNs price shouldn’t be expected to come close to the inverse of changes in the related index. While the performance of the note over the life of the obligation will meet that objective, the steep run-up in value (XXV has gained more than 70% since inception last July) has diminished the sensitivity to further movements in the index.

E-TRACS Daily Long-Short VIX ETN (XVIX)

This ETN from UBS is unique in that the underlying index includes both long and short exposure to VIX–specifically a 100% long position in mid-term VIX futures and a 50% short position in short-term VIX futures contracts. The short position positions XVIX to benefit from the structural inefficiencies in the VIX futures markets, while the long position allows for exposure to volatility that may not be impacted as adversely by contango. XVIX rebalances exposure on a daily basis.
The methodology behind XVIX makes this product very unique from the others highlighted above in terms of risk/return profile. The combination of long and short exposure to similar asset classes results in a relatively low volatility–a feature the other inverse VIX ETNs do not share. XVIX might be useful for those looking to add non-correlated assets to their portfolio, as the movements in the underlying benchmark will generally exhibit very little correlation to stocks or bonds [Examining VIX ETF Performance During A Sell-Off].

Big Differences In Performance

The nuances highlighted above may seem subtle, but they can have a huge impact on performance. Through the end of last week XIV had gained about 30% year-to-date, more than quadrupling the gains turned in by another inverse VIX ETN (XXV was up about 7%).
Each of these products has the potential to be a very useful tool or a wildly inappropriate mechanism; that all depends on the risk tolerance and objectives of the individual investor [Using ETFs To Access Alternatives].

Saturday, September 10, 2011

xiv,tvix,vxx


Inverse VIX ETNs: Delivering Free Money?


Inverse VIX ETNs: Delivering Free Money?


http://seekingalpha.com/article/251767-inverse-vix-etns-delivering-free-money


As the ETF industry expanded in recent years ongoing innovation has given investors more precise tools for accessing various corners of the stock and bond markets, as well as securities that deliver exposure to previously hard-to-reach asset classes and investment strategies. Many of the exchange-traded products to debut over the last several years utilize futures contracts and derivatives to achieve their objectives, introducing additional complexity and risk factors. When used correctly, these products can be powerful tools to hedge exposure, speculate on short term price swings, or implement advanced strategies. But they also introduce the potential to get burned when used incorrectly.
The volatility ETP space has exploded over the last year or so, as investors have embraced the exchange-traded structure as an efficient way to access an asset class that has the potential to deliver valuable diversification benefits but that can be hard to access and maintain for many investors. Because the VIX (and other volatility indexes, such as the one linked to CVOL) tends to spike when equity markets are falling the correlation between the VIX and stocks is generally close to -1.0, giving the products in the Volatility ETFdb Category appeal for investors looking to smooth overall volatility or install a partial equity market hedge.
But the various VIX ETPs are similar to many commodity products in that they don’t offer exposure to the spot VIX, but rather achieve exposure to this asset through futures contracts. Because the market for VIX futures is generally in steep contango - especially in the short-term, the impact of contango on returns can be significant when positions are held open for multiple trading sessions. Since debuting in early 2009, the iPath Short-Term VIX Futures ETN (VXX) has lost more than 90% of its value - a considerably bigger drop than the 60% decline in the spot VIX over the same period.
Volatility ETPs can perhaps be best thought of as insurance policies; when equity markets encounter turmoil, they can be expected to perform well and will be one of the best ways to cushion the blow felt by many portfolios. But in return for the unparalleled protection during crises, investors pay a hefty premium in the form of a steep roll yield to maintain exposure to futures contracts.
Recent innovation in the ETF space has produced products that essentially allow investors to play the role of the insurance company, essentially exploiting the steepness at the short end of the VIX futures curve. The VelocityShares Daily Inverse VIX Short-Term ETN (XIV), for example, will deliver returns equal to the inverse of the S&P 500 VIX Short-Term Futures Index, a benchmark that offers exposure to a daily rolling long position in the first and second month VIX futures contracts and reflects the implied volatility of the S&P 500 Index.
An inverse VIX ETN may seem like an odd concept; because the VIX and equity markets generally move in opposite directions, a bet that volatility will drop might seem like another way of betting that equity markets will rise - in which case establishing exposure to stocks might seem like a more logical play. But because XIV seeks to deliver results that correspond to the inverse of a futures-based index, it has the potential to perform well in markets where stocks and the VIX are flat. That’s because the steep contango in VIX futures markets that creates headwinds for investors in a “long volatility” fund like VXX generates tailwinds at the back of those invested in XIV.
A look at January performances shows some pretty interesting returns. The spot VIX rose by about 10% last month, but VXX was down by about 15% on the month - illustrating just how significant the impact of contango can be on a futures-based fund. But the more intriguing performance is that of XIV; the “inverse VIX” ETN was up 15% during a month when the spot VIX increased 10%.
That jump came after XIV surged by about 25% in December, a month that saw both the spot VIX and VXX tumble as global equity markets staged a year-end rally. During the two-month stretch, XIV climbed a whopping 51%; the VIX and VXX dropped by 27% and 38%, respectively, during the same period. And XIV’s impressive gains blew out SPY, which added a relatively meager 11%:
Click to enlarge
XIV’s track record is obviously limited, but the ETN’s ability to generate gains in periods of both rising and falling volatility should be intriguing to various types of investors.
XIV does, of course, come with some risks. Because the exposure to the underlying index resets on a daily basis, oscillating markets - where gains are followed by losses and vice versa - can potentially result in return erosion (similar to the manner in which leveraged ETFs functioned during 2008). And while XIV managed to gain ground when the VIX jumped in January, it likely wouldn’t move higher if volatility markets staged a repeat of 2008. The VIX closed at an all time high of 80.86 in November 2008, jumping by nearly 300% over a three month stretch.
Many investors have expressed frustration over the nuances of futures-based products, lamenting the “return lag” that such a strategy often produces. But XIV allows investors to jump over to the other side of the table and exploit the upward sloping futures curve. The ETF boom has made various alternatives more accessible than ever, and XIV is one alternative ETF that is worth a closer look.


Thursday, February 25, 2010

Daily Fib chart Briefing

Thursday, January 28, 2010

Saturday, January 23, 2010

Friday, January 22, 2010


Very similar sell-off.

10-26: 1st leg down 3days 26pt, -2.4%
then up 1day 21 pt, 2%
2nd leg down 4days 54 pnts -4.9%
then up 1day 25pts, 2.4%
3rd leg down 2 days 37 pnts, 3.5%
total down 9days, 72pnts, -6.5%

2007: 1st leg down 5days -70 points or -4.8%
then up 26 points, or 1.8% from low
2nd leg down 3 days -42 points or -3%
then 5 days bounce 36 points or 2.6%
3rd leg down 2day 45pt -3.2%
total 15day down 96pts, -6.6%

2004: 1st leg 4days -56 points or -4.9%
then monday up 15 points or 1.4% from low
2nd leg down 17pt -1.5%
then up 2days 24pt 2.2%
3rd leg down 5days 39 pt, -3.6%
total 13 days down 76pt, -6.5%

2010: 1st leg down 3 days -60 points or -5.2%

If bounce off Monday (looking for 15-20 points from low, 1.5~1.8%), sell every thing!

Monday, January 18, 2010

Friday, January 15, 2010

Tuesday, January 12, 2010

Monday, January 11, 2010

Saturday, January 09, 2010


ES close at 1141.5. Both daily AL and intraday AL target were hit. ES also hit the up line of a likely 5th-wave end-diagonal wedge, and two other bigger wedge TLs. Needless to say, there is a huge resistance here . Indicator wise, STO stays above 80 for 5 days now, and negative divergences are every where.

On Sunday night, watch for any pullback to initiate a gap fill trade. If market pulls back to 1136-37, watch closely for buying activity.
On Monday morning, if market couldn't hold above 1136-1137 due to lacking of buying activity, this bull run is done for certain, as breaking this levels also marks the break down of the end-diagonal channel.

Watch DoubleMA signal for initiate spy option trade.


Friday, January 08, 2010

Thursday, January 07, 2010

http://tradeflight.com/

2009 ES Gap Fill Summary

January 5th, 2010 • FuturesComments Off

Many traders regard the gap fill on the E-mini S&P 500 futures contract (designated on many trading platforms by ticker symbol root ES) as one of the highest probability trades each trading day.

Well, let’s see if the statistics held true in 2009. The gap fill is defined by price action that touches or breaks through the closing price of the previous trading day.

Since many traders regard the 4:00PM Eastern Time close as the gap to be filled, we’ll use the 4:00PM closing time for our analysis. Many trading platforms show the ES closing prices based on the 4:15PM session close, so custom tweaks are required to show the previous trading day’s 4:00PM closing price.

In this analysis, we track the number of trading days the ES filled its gap, or at least touched the 4:00 closing price from the previous trading day. We also observe the hourly time slot the ES first fills its gap on gap fill days.

Traders often regard the half gap fill as an even higher probability trade. The half gap is defined as half the distance between the opening price at 9:30AM Eastern Time and the previous trading day’s 4:00PM closing price.

No surprise here: Further analysis of the ES reveals that the half gap fill was truly a higher probability trade in 2009.

IMPORTANT DISCLAIMERS
Of course, past performance and 2009 statistics are no guarantee for future results. And, 60-80% probabilities do not necessarily reflect optimal trade entry and exit execution points. Finally, not every trading day affords a gap fill or half gap fill that is worth taking. Traders must ask themselves whether the remaining distance to the gap or half gap is worth the risk:reward ratio involved from the point of entry and stop loss levels. Often, ES gap fill trade setups occur in premarket globex trading hours, before the 9:30AM opening bell. Trades always require discretion and should never be placed blindly. However, astute traders keep these things in mind as they observe what many regard as one of the highest probability ES trades.

FUTURE ANALYSIS
We can continue our study of ES gap fills by considering 4:15PM closing prices, the average number of points for trades placed precisely at 9:30AM market open, option expiration day Fridays, etc. Perhaps we’ll revisit a few of these in the near future.

Tuesday, January 05, 2010

Market indicators summary 1/6/10

Vix,vix/vnx: oversold, vix/vnx turnup
US$/Euro: oversold, little room for down
TLT: oversold
GLD: oversold/turnup
NYSI: up
NYMO: peak
NYAD:
NYHL: peak
EW:
Fib tgt: 1136/1138

Market indicators summary 1/5/10
Vix,vix/vnx: little room to go down
US$/Euro: still has some room to go down
TLT: oversold
GLD: oversold/tick up
NYSI: up
NYMO: up
NYAD: peaked
NYHL: overbought
EW:


Thursday, December 31, 2009


The last half hour sell-off may imply people are nerves about an anticipated pullback for the new year, and they want to get out of the market right before entering 2010. The sell-off could very well mark the end of the run-up, and the beginning of a down swing. However, Es is near some support levels and has already bounced quite a bit after hour. Watch for the 1115 level, see if the sell-off will continue from there. As both MACD and STO give sell signal, to play it Buy spy Feb put 110 into market strength if there is any strength on Monday.


On daily charts, the C wave run-up for all major indice may have been already finished.


The inter-market indicators, eventually all point to the same down direction for uncle Sam.


For ES trade, look for short entry around 1115 and long around 1108 Sunday night and Monday morning.